compiled by Wm. Robert Johnston
last updated 4 August 2024
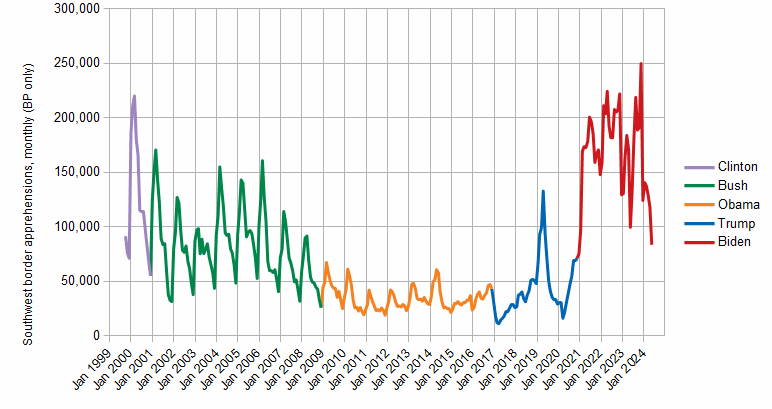
Figure 1: Monthly southwest border apprehensions by administration, Border Patrol only
Figure 2: Monthly southwest border apprehensions of unaccompanied minors by administration, Border Patrol only

Figure 3: Monthly southwest border apprehensions of family units by administration, Border Patrol only
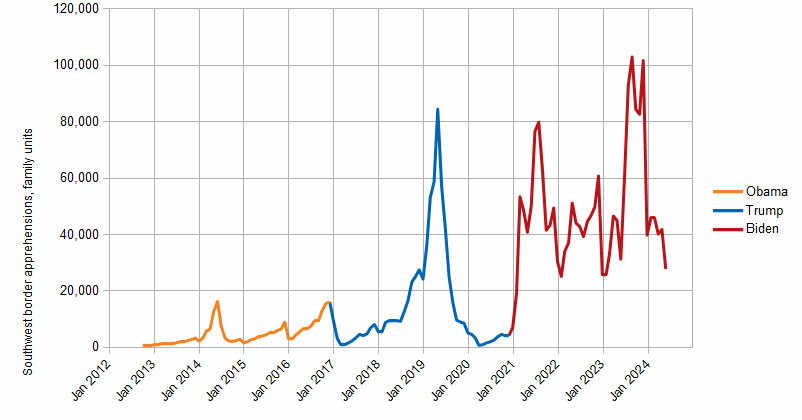
Figure 4: Monthly southwest border apprehensions of single adults by administration, Border Patrol only
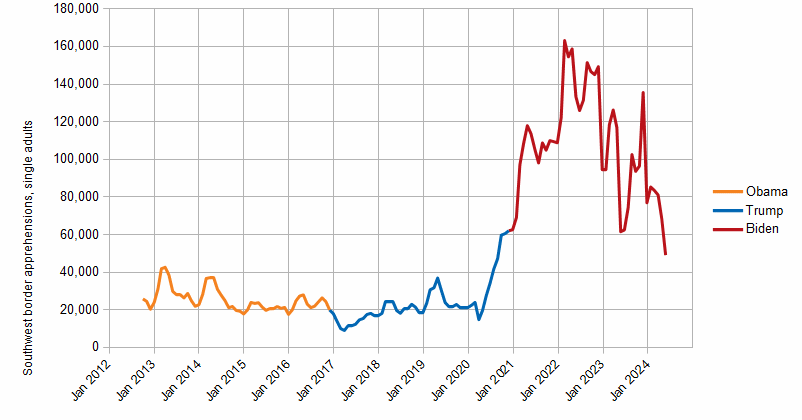
Figure 5: Monthly southwest border apprehensions by administration, averages by calendar month
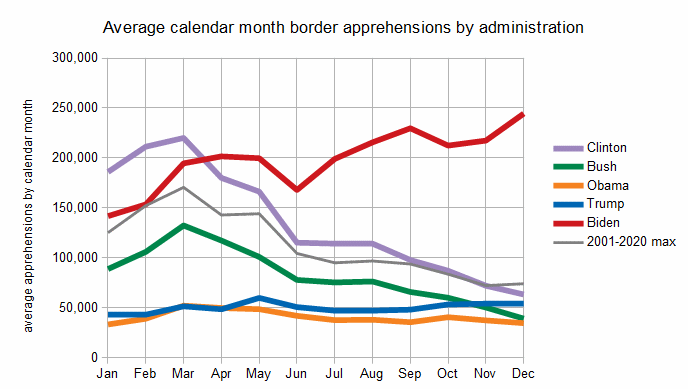
Figure 6: Monthly southwest border apprehensions of unaccompanied minors by administration, averages by calendar month
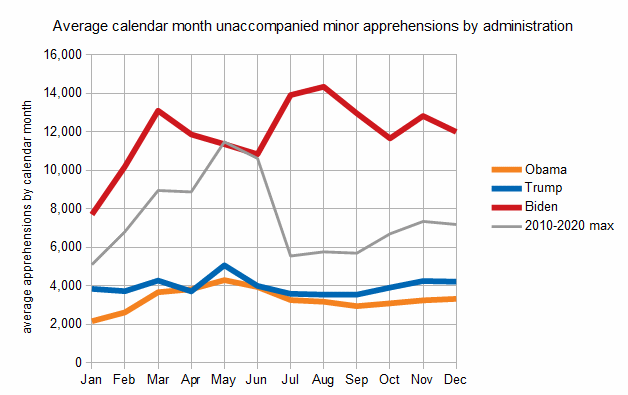
Figure 7: COVID-19 statistics for immigration detainees as reported by ICE--cumulative data
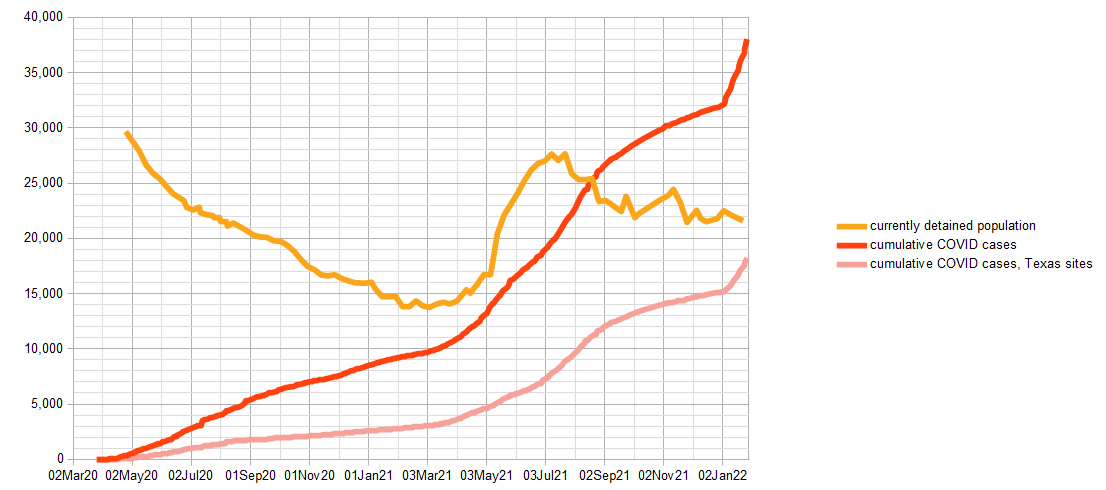
Figure 8: COVID-19 statistics for immigration detainees as reported by ICE--current COVID-19 cases
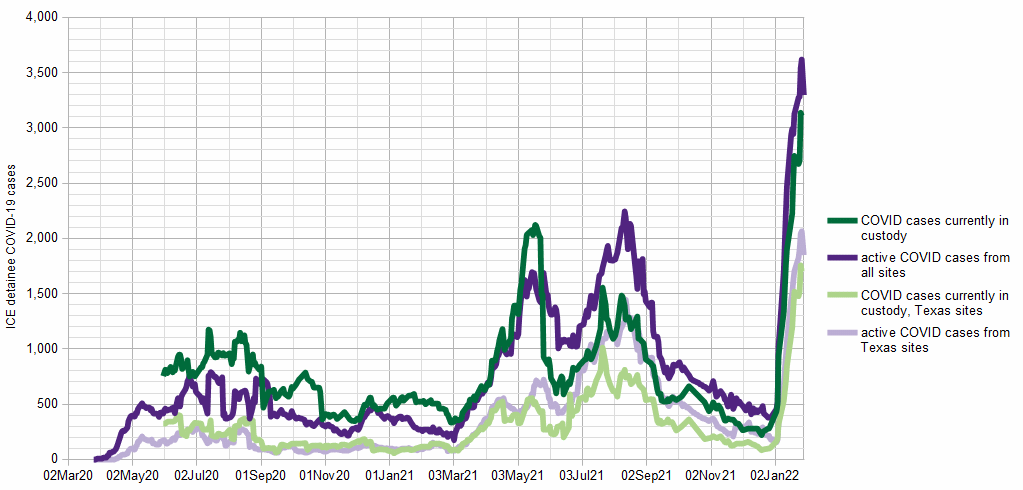
Figure 9: Estimated active COVID-19 case rate in U.S. general population and ICE detainee population (ICE data)
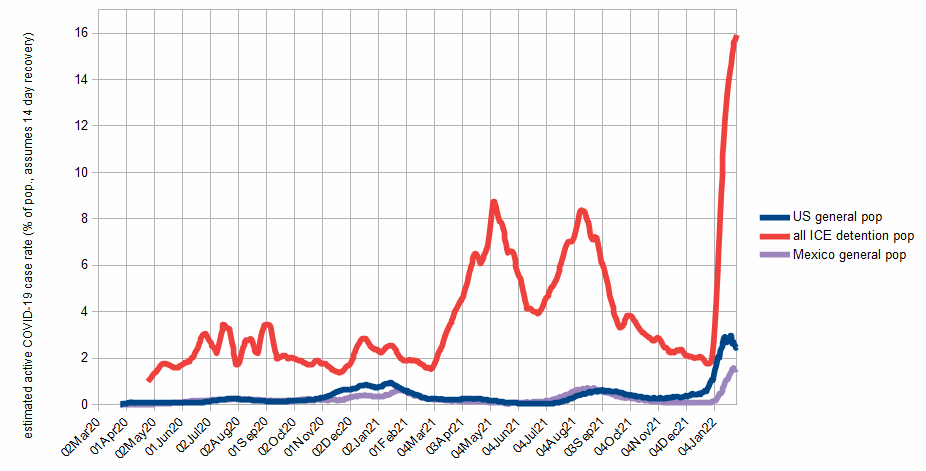
Figure 10: Estimated active COVID-19 rates for U.S.-Mexico border states

Resources:
© 2021-2024, 2024 by Wm. Robert Johnston.
Last modified 4 August 2024.
Return to Home. Return to Other Policy Issues.